

Return targets
Judge allocations against a benchmark, a fixed return, or inflation plus a margin
BenchmarkReturn target
TargetFixedInflation + fixed
BasisCPI+2.0%
Upload a target pathReturn target, p.a.CPI + 2.0%
Solutions
Most investment tools are good at describing what has already happened. ATLAS is built around what could happen next.
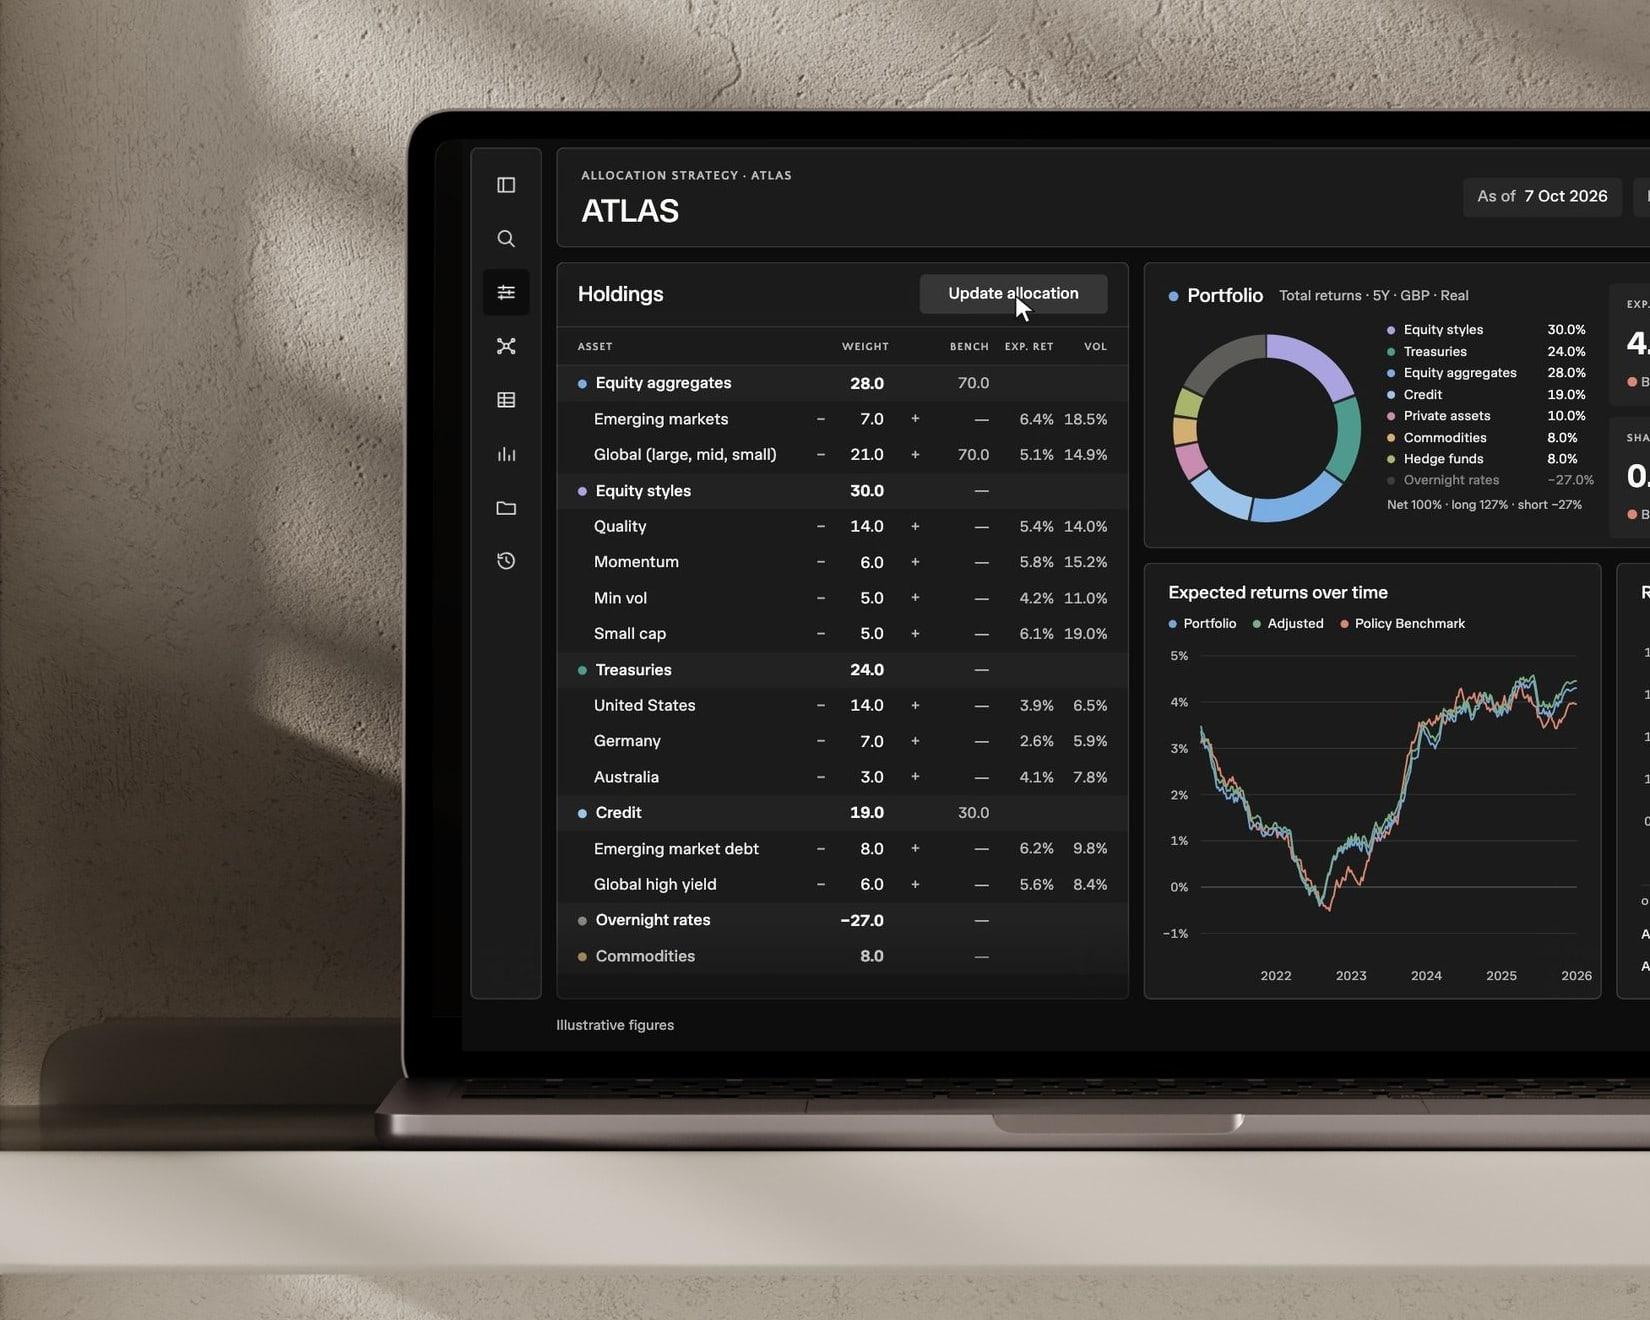
ATLAS integrates forward-looking expected returns, stochastic return paths, scenarios, and optimisers into a single tool. We give investors powerful foundations to explore future opportunities and risks across assets and translate them directly into portfolio implications.
Workflows
Build, refine, and evaluate your asset allocation at every step

About
ATLAS is built for the questions that sit at the centre of asset allocation: where expected returns are most attractive, how risks are changing, what different macro paths imply, and how much capital to allocate to each opportunity.
Those questions can be explored consistently across asset classes, where total portfolio perspective sits at the centre of our approach.
ATLAS
ATLAS evaluates allocations across a forward-looking map of vast numbers of possible alternatives, it is not a typical calculation engine based on historical data.
With each edit, allocations are re-evaluated across millions of simulated outcomes in real time, revealing how expected performance, risk, resilience, and much more, change with every decision.
Integrated analysis
Assess portfolio, benchmark, funding and overlay decisions in one place.
Assess opportunities against the current allocation, retain them for review, and combine or sequence them.
18
Currency perspectives
1–30 Years
Horizons covered
Adjust any input across the platform and assess portfolio impact immediately.
Quickly evaluate the impact of decisions against the current allocation.
Features
Our engine enables clients to capture the complexities of their portfolios and strategies and to tackle the most complex asset allocation questions
Return targets
Judge allocations against a benchmark, a fixed return, or inflation plus a margin
Scenario Analysis
ATLAS brings scenario analysis directly into the portfolio construction process. We build and maintain forward-looking scenarios that matter to allocators, and users can explore in real time how changes to portfolios affect outcomes across both upside and downside environments.
Investors can identify vulnerabilities, judge rewards for taking risk, and understand the opportunity cost of protecting against adverse outcomes.
Frontier AI Breakthroughs
Successive frontier model releases treated as news about the pace of AI capability progress.
Soft Landing
Broad-based improvement: moderating inflation, resilient growth, easing central banks, favourable risk-asset environment.
US Fiscal Expansion
Sustained widening of the US fiscal impulse; growth/inflation expectations lift and Treasury supply rises.
Easing Cycle
Central banks ease without activity collapse; yields fall, earnings improve, premiums compress.
Front-loaded Earnings Boom
Strong earnings burst mistaken for productivity regime; eventually disappoints and premiums reverse.
Melt-up
Positioning squeeze drives valuations higher without fundamentals; eventual unwind as squeeze fades.
Productivity Boom
Genuine US productivity improvement; strong earnings, rising neutral rates, gradual global diffusion.
Reflation Boom
Broad expansion lifts demand/earnings; equity premiums compress, inflation and yields rise as the boom matures.
Soft Landing
Inflation falls without recession; progressive confirmation of landing, falling yields, and compressing premiums.
AI Disappoints
AI progress stalls due to technical/cost hurdles; corporate AI investment retrenches, sharp correction in AI-linked sectors.
Central Bank Politicisation
Monetary policy politicised under fiscal pressure; inflation de-anchors, real rates compressed, markets reprice premiums.
Fiscal Dominance
Joint fiscal-credibility and central-bank politicisation shock; debt monetisation risk, rising term premia, de-anchoring inflation.
Geopolitical Escalation
Broad geopolitical deterioration with regional conflicts and strategic competition; recurring supply disruptions and higher risk premiums.
Sovereign Fiscal Stress
Sharp decline in fiscal sustainability confidence; higher sovereign yields, currency volatility, and tighter monetary conditions.
Trade Conflict & Decoupling
Progressive global decoupling with escalating tariffs; supply-side shocks reduce growth while central banks contain inflation.
Demand Shock
Global demand downturn starting in the US; recession risk rises, yields fall, equity/liquidity premiums spike.
Hard Landing
Downturn initially looks conventional but deepens; cancelled investment and labour-market damage create lasting growth scars.
Inflation Scare
Inflation surprise triggers tightening; yields and premiums rise, then gradually subside over several years.
Near-term Recession
Conventional US-led recession spreading globally; easing cycle, falling yields, rising equity/liquidity premiums with eventual recovery.
FAQs
ATLAS is a dedicated asset allocation platform built on Allocation Strategy's forward-looking modelling engine. It brings expected returns, risk, scenarios, simulations and portfolio construction together in one consistent environment. ATLAS is built for investment teams making top-down portfolio decisions across asset classes — including asset allocation, investment strategy, total portfolio, multi-asset and CIO teams.
ATLAS is used for asset allocation decisions. Examples include: reviewing strategic allocations, comparing whether to add to equities or credit, testing the portfolio impact of a higher-inflation scenario, deciding how to fund a new private-market investment, or assessing whether an active position is worth the benchmark risk it consumes. Teams also use it to benchmark their CMAs, design glide paths, support tactical allocation, and evaluate whether diverse allocations improve total portfolio outcomes.
Most portfolio systems are designed to record holdings, measure historical performance or report risk. ATLAS is built to help investors make forward-looking allocation decisions by modelling what markets are pricing today, how the opportunity set could evolve, and what that means for portfolios.
Our models start from current market pricing and expectations rather than relying on historical averages or assuming past relationships will repeat. Expected returns, risk and scenarios update as valuations, yields and market conditions change.
ATLAS is designed for broad multi-asset allocation across public and private markets. The framework spans major asset classes, regions, currencies and more granular investment opportunities within a common analytical system.
Yes. Investors can use ATLAS to analyse their own asset allocation, benchmark exposures and portfolio choices against Allocation Strategy's analytics. We cover the nuances of asset allocation such as hedging requirements, glide paths, currencies, and real return targets.
ATLAS models rich distributions of possible future outcomes across horizons. Risk is calibrated using forward-looking data, rather than simply calculating historical volatility and correlations. Risk and cross-asset relationships evolve through time and across investment horizons, creating a more realistic view of uncertainty within asset allocation decisions.
Usually not. ATLAS is designed to complement systems of record, reporting platforms and internal tools by providing a dedicated forward-looking asset allocation layer that other systems typically do not provide.
Implementation is tailored to the team's portfolio, investment universe and workflow. Allocation Strategy works with users to establish the relevant assets, assumptions, benchmarks and integrations so ATLAS fits directly into the existing investment process.
Insights
